How do we know the current drought in the U.S. Southwest is the worst in more than 1,000 years?
The short answer:
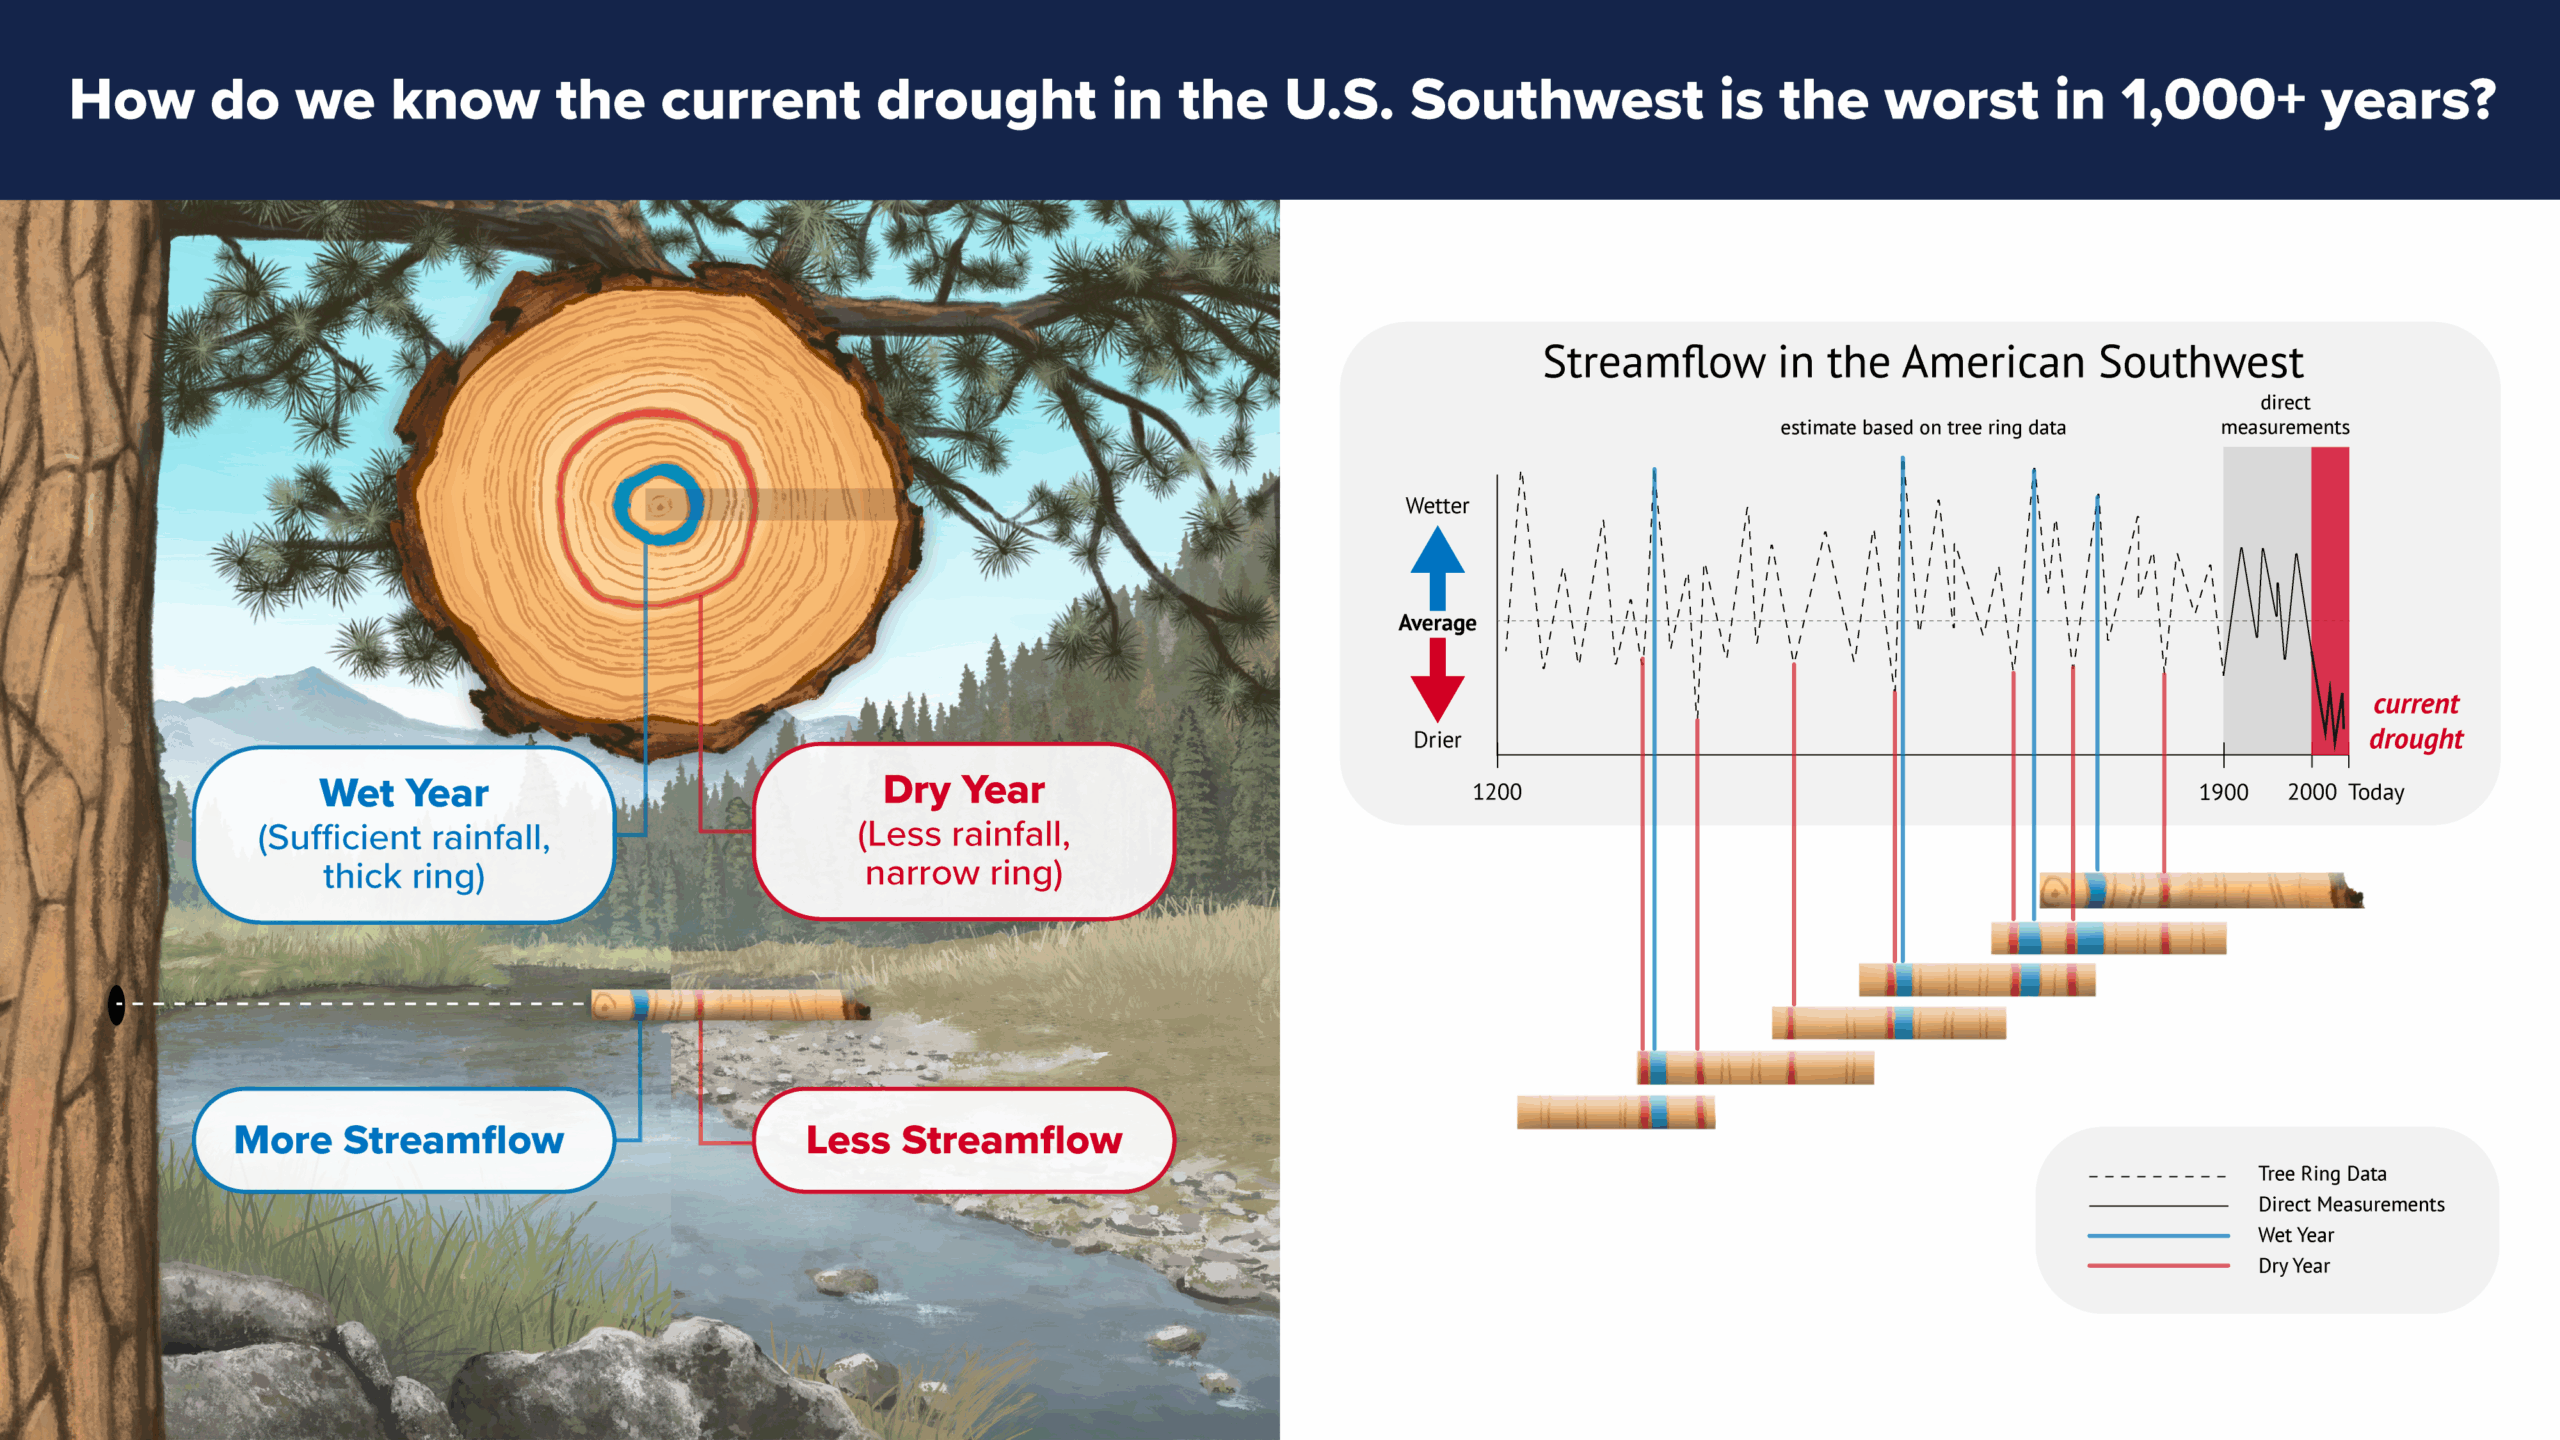
Scientists say that the ongoing, extreme drought in the southwestern United States is the worst in more than a thousand years. How can they know this when even our longest direct measurements of temperature and soil moisture only go back about a hundred years? Scientists use trees to look back in time to before we had direct climate observations.
Tree growth is influenced by weather and soil moisture. Every year, trees grow wider and add a layer of wood to their trunk, called a tree ring. During a wetter year, trees grow more, forming a wider ring. If the year is dryer, the ring is thinner. The water that is available to trees is a good indicator of how wet or dry a region is in general.
Scientists used patterns in rings from drought-sensitive trees across the Southwest to create a record of soil moisture extending back more than 1,200 years. The resulting soil moisture record showed that the period from 2000-2021 was the driest 22 year period of the past 1,200 years.
Media downloads:
| NAME | DESCRIPTION | SIZE | LENGTH |
|---|---|---|---|
| Drought Length Evidence Animation (zip) | Video with no voiceover or captions plus sample script | 79 MB | 46s |
Design team:
Student Developers:
Emma Riehle, DeeDee DuPlessis, Yva Luc, Anastasia Seckers, Danielle Tadych, Paige Cherry, Fern Bromley, Wenjing Zhang, Harish Vernekar, and Lev Brikmanis
Translators:
Wilzave Quiles Guzman, Rosario Chambers
Advisors:
Project Manager: Sara Kobilka
Science Advisors: Ellie Broadman and Laura Condon
Graphic Designers:
Ryan Hunt and Megan Roxbury
Infographic:
(click image to enlarge)
On Social Media:
Video Source:
References and Additional Resources:
To learn more about this question checkout these resources:
- Rott, Nathan. Study finds Western megadrought is the worst in 1,200 years. NPR Research News. 14, February, 2022
- Bauer, Bruce How tree rings tell time and climate history. Climate.gov 29 November, 2018
- St. George, Scott & National Center for Atmospheric Research Staff (Eds). “The Climate Data Guide: Tree-ring width chronologies: An overview of their use as climate proxies and of available databases.” Last modified 2023-07-29
- University of Arizona Laboratory of Tree Ring Research. About Tree Rings.
- University of Arizona Laboratory of Tree Ring Research. Crossdating – The Basic Principle of Dendrochronology.
- Burnette, D.J., 2021: The Tree-Ring Drought Atlas Portal: Gridded drought reconstructions for the past 500-2000 years. Bulletin of the American Meteorological Society, 102, 953-956.
- Williams, A.P., Cook, B.I. & Smerdon, J.E. Rapid intensification of the emerging southwestern North American megadrought in 2020–2021. Nat. Clim. Chang. 12, 232–234 (2022).
¿Cómo sabemos que la sequía es la más grave en 1,000 años?
La respuesta corta:
Los científicos afirman que la extrema sequía que azota actualmente el suroeste de Estados Unidos es la peor en más de mil años. ¿Cómo pueden saberlo si nuestras mediciones directas más antiguas de temperatura y humedad del suelo solo se remontan a unos cien años atrás? Los científicos utilizan los árboles para retroceder en el tiempo hasta antes de que dispusiéramos de observaciones climáticas directas.
El crecimiento de los árboles se ve influido por el clima y la humedad del suelo. Cada año, los árboles crecen en anchura y añaden una capa de madera a su tronco, llamada anillo de árbol. Durante un año más húmedo, los árboles crecen más, formando un anillo más ancho. Si el año es más seco, el anillo es más delgado. El agua de la que disponen los árboles es un buen indicador de lo húmeda o seca que es una región en general.
Los científicos utilizaron los patrones de los anillos de los árboles sensibles a la sequía en todo el suroeste para crear un registro de la humedad del suelo que se remonta a más de 1200 años. El registro de humedad del suelo resultante mostró que el período comprendido entre 2000 y 2021 fue el más seco de los últimos 1200 años.
Materiales disponibles para descarga:
| TÍTULO | DESCRIPCIÓN | TAMAÑO | DURACIÓN |
|---|---|---|---|
| Drought Length Evidence Animation Español (zip) | Video sin voz y sin subtítulos | 75 MB | 45s |
El equipo de Diseño:
Estudiante Desarrolladores:
Emma Riehle, DeeDee DuPlessis, Yva Luc, Anastasia Seckers, Danielle Tadych, Paige Cherry, Fern Bromley, Wenjing Zhang, Harish Vernekar, and Lev Brikmanis
Traductas:
Wilzave Quiles Guzman, Rosario Chambers
Consejeros:
La Manejada del Projecto: Sara Kobilka
Asesores científicos: Ellie Broadman and Laura Condon
Diseñadores gráficos:
Ryan Hunt and Megan Roxbury
Infografía:
(haga clic en la imagen para ampliar)

Referencias y recursos adicionales:
Para obtener más información sobre esta pregunta, consulta estos recursos:
- Fausto, Urriste. El secreto oculto en los árboles: qué revelan sus anillos sobre las sequías y olas de calor extremo. 9 October, 2025.
- Rott, Nathan. Study finds Western megadrought is the worst in 1,200 years. NPR Research News. 14 February, 2022
- Bauer, Bruce How tree rings tell time and climate history. Climate.gov 29 November, 2018
- St. George, Scott & National Center for Atmospheric Research Staff (Eds). “The Climate Data Guide: Tree-ring width chronologies: An overview of their use as climate proxies and of available databases.” Last modified 2023-07-29
- University of Arizona Laboratory of Tree Ring Research. About Tree Rings.
- University of Arizona Laboratory of Tree Ring Research. Crossdating – The Basic Principle of Dendrochronology.
- Burnette, D.J., 2021: The Tree-Ring Drought Atlas Portal: Gridded drought reconstructions for the past 500-2000 years. Bulletin of the American Meteorological Society, 102, 953-956.
- Williams, A.P., Cook, B.I. & Smerdon, J.E. Rapid intensification of the emerging southwestern North American megadrought in 2020–2021. Nat. Clim. Chang. 12, 232–234 (2022).